Warunki Meteo

Aktualne Sygna³y z ceilometru CHM15k  w laboratorium Transferu radiacyjnego Instytutu Geofizyki UW, Warszawa. 

Ceilometr dzia³a w trybie ci±g³ym a wykresy aktualizowane s± co 1 godzinê. W zwi±zku z wybuchem wulkanu wykresy generowane s± co 15 minut. Wykresy archiwalne. Dane o zawarto¶ci aerozolu nad Polsk± mierzone s± poza IGF-UW w Instytucie Oceanologii w Sopocie, Stacji pomiarowej PANu w Belsku i prywatnej stacji SolarAOT na Podkarpaciu. Wyniki dostêpne s± pod na stronie PolandAOD. Polska Akademia Nauk prowadzi równie¿ pomiary py³u na Spitsbergenie w Horsundzie.


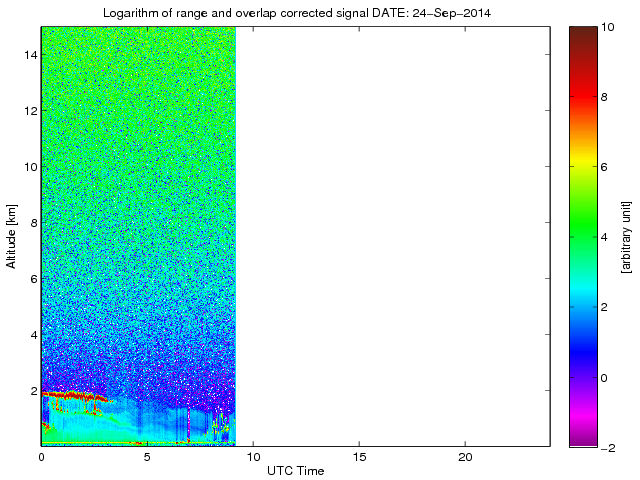
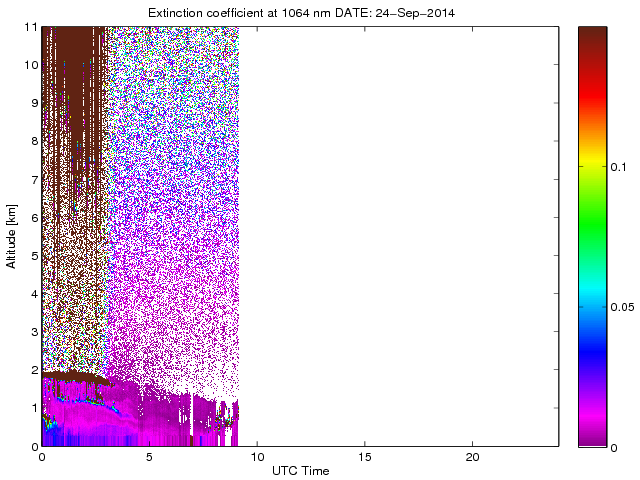
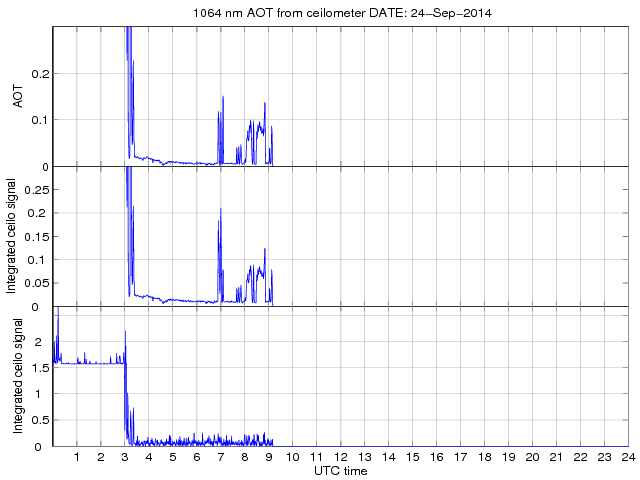
On-line signals measured by the CHM_15k ceilometer based in the Radiative Transfer LABoratory of the Institute of Geophysics of the University of Warsaw (RTLab IGF UW) in Warsaw, Poland.  These standard plots are updated each hour. Concerning the measurements connected with the Grimsvotn volcanic ash the CHM_15k ceilometer was switched onto a continuous operation mode. The quick-looks of the obtained data are available via archived plots.

Wykres przedstwia sygna³ z ceilometru CHM15K w zale¿no¶ci od czasu i wysoko¶ci nad powierzchniê ziemi. Signal zosta³ skorygowany na odleglo¶æ od przyrz±du (range corrected signal) oraz skorygowany na poprawkê zwi±zan± z kompresj± geometryczn±. Poprawka ta daje poprawny sygna³ od 200 metrów na przyrz±dem. Dziêki czemu umo¿liwia on detekcjê aerozolu tu¿ nad ziemi±. Kolorem czerownym i br±zowym widoczne s± na mapie chmury.
Figs. 1 and 2. depict the range and overlap corrected CHM_15k ceilometer signals (in a.u.) available from 200 m a.g. and the logarithm of the mentioned signals, respectively.

To samo co powy¿ej jednak po wziêciu logaytmu sygna³u. Umo¿liwi± to lepsz± analizê w³asno¶ci optycznych chmur.
Figs. 1 and 2. depict the range and overlap corrected CHM_15k ceilometer signals (in a.u.) available from 200 m a.g. and the logarithm of the mentioned signals, respectively.

Surowe mapy dobowe ekstynkcji aerozolu dla d³ugo¶ci fali 1064 nm na podstawie sygna³u z ceilometru. Wielko¶æ ta zosta³a obliczona przy wykorzystaniu algorytmu Portera. W przypadku pojawiaj±cych siê chmur algorytm dzia³a produkuje b³êdne rezultaty.
Fig. 3 depicts the extinction coefficient profiles at 1064 nm calculated from the CHM_15k ceilometer signals using an algorithm described by Potter et al., 2000. Note: the extinction calculation is erroneous and has no physical meaning in the cases when clouds appear in ceilometer signal.
References:
Porter, J. N., B. Lienert, and S. K. Sharma, 2000: Using the horizontal and slant lidar calibration methods to obtain aerosol scattering coefficients from a coastal lidar in Hawaii, J. Atmos. Oceanic Technol., 17, pp. 1445–1454.

Grubo¶æ optyczna w warstwie 0.2-3.0 km oraz wyca³kowany sygna³ lidarowy w tym samym zakresie wysoko¶ci.

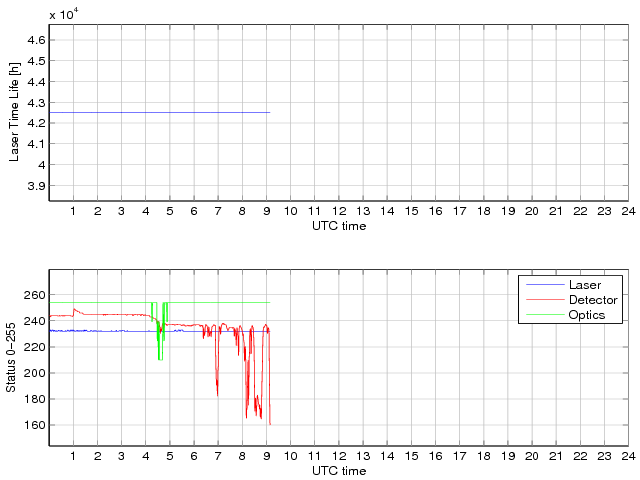
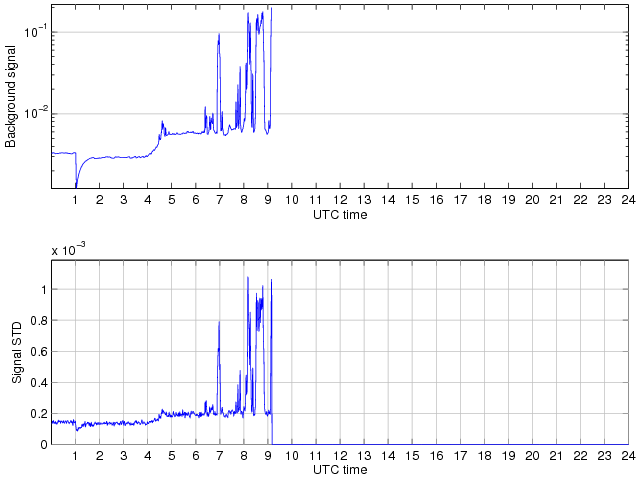
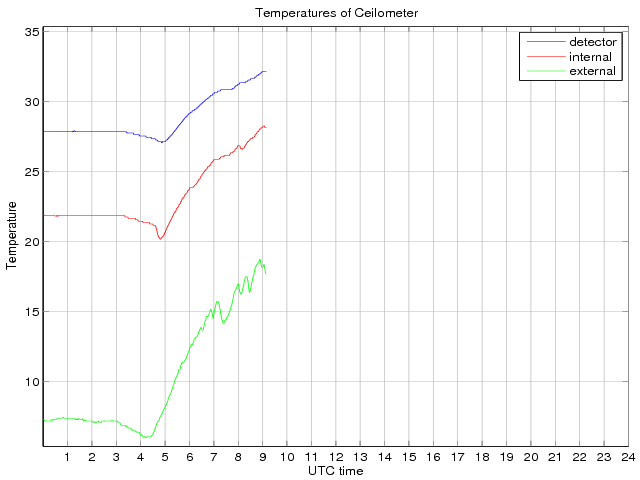
Wielko¶ci do monitoringu ceilometru.