IGF


Geophysical laboratory I / II Academic year 2026/2027

Rok akademicki: 2026/2027
Semestr: zimowy/letni

OPIS PRZEDMIOTU

Geophysical Laboratory  I (summer semester) / II (winter semester)

Rules for academic year 2026/2027 (both semesters)

Field of study: Geophysics (Physics, 2nd-stage studies)

Organizational unit: University of Warsaw, Faculty of Physics, Institute of Geophysics

Coordinator: Iwona Stachlewska (iwona.stachlewska@fuw.edu.pl)

Tutors: Gustavo Abade, Michalina Broda, Michał Ciuryło, Piotr Dziekan, Afwan Hafiz, Łucja Janicka, Paweł Jedrejko, Maciej Karasewicz, Konrad Kossacki, Tycjan Kossowski-Kołodziej, Szymon Malinowski, Krzysztof Markowicz, Tomasz Mikołajków, Hanna Pawłowska, Jakub Spała, Iwona Stachlewska, Jan Szymankiewicz, Dominika Szczepanik, Mirosław Szczyrba, Artur Tomczak, Marta Wacławczyk, Mikołaj Zawadzki.

Important information for students in academic year 2026/2027: 
This topic follows deadlines for the Academic calendar of University of Warsaw
https://www.uw.edu.pl/kalendarz-akademicki/

For GL-II, 
The end of the wintertime exam session (8 February 2027) is the deadline for submitting initial reports; 
while the end of the resit exam session (28 February 2027) is the deadline for submitting revised reports, if needed.

For GL-I, 
note that the end of the summertime exam session (27 June 2027) is the deadline for submitting initial reports; 
while the end of the resit exam session (12 September 2027) is the deadline for submitting revised reports, if needed.

Tutors will assess and give mark ONLY to the reports that were submitted no later than 1 day BEFORE the specified deadline dates!

Tutors will not assess student work, progress nor reports during period of summer holidays (1 July to 1 September 2027).

***

Description:

The aim of the Laboratory is to familiarize students with experimental and theoretical methods and advanced analysis of geophysical data. The thematic scope of the proposed exercises includes topics in atmospheric physics, lithosphere physics and planetology.

The laboratory consists of performing three (GL II winter semester) or four (GL I semester) exercises in each of the topics:

a) physics and chemistry, b) thermodynamics, c) radiation, d) fluid dynamics, e) remote sensing, f) modelling, and g) litosphere.

Descriptions of the proposed exercises with names of tutors are listed below.

Literature is determined by tutors, according to the individual topic and scope of the exercise.

Assessment of the final grade is based on the student's reports on the selected exercises (3 for GL II and 4 for GL I). Each report is evaluated by the tutor(s). The final grade is the average of the ratings obtained from the individual reports.

Lack of performing the given above obligatory number of exercises results in failing the subject !!!

The laboratory is realized solely in English.

Student workload:
- preparation for exercises 30h (GL II), 40h (GL I)
- exercises 30h (GL II), 30h (GL I)
- preparation of results and reports 30h (GL II), 40h (GL I)

IMPORTANT: Students that have performed a certain exercise in the previous semesters are not allowed to perform the same exercise in the current semester. Plagiarism, including auto-plagiarism is not allowed!  

In the submitted reports STUDENTS are obligated to add information: "Herewith, I declare that I have not performed this exercise in any of the previous semesters. Herewith, I declare that there is no plagiarism in this report".

TUTORS are obligated to check the reports for plagiarism and add information: "No plagiarism detected", along with the grade, date, and signature on the first page of each evaluated report. The scan/photo/pdf of this page has to be provided by the tutor to the coordinator asap.

Procedure:

1. The student selects the exercises from the list below choosing 3 (GL II winter semester) or 4 (GL I semester) exercises, each in different topic: a) physics and chemistry, b) thermodynamics, c) radiation, d) fluid dynamics, e) remote sensing, f) modelling, and g) litosphere. Then student contacts the tutors (per mail or personally) to confirm that the exercise can be performed in a given semester.
2. Information about selected and confirmed exercises must be communicated by the student to the GL coordinator within 2 months from the beginning of each semester.
3. The student carries out each exercise under the tutor(s) supervision.
4. After completing the exercise, the student prepares a report and submits it for review by the tutor.
5. The coordinator receives an evaluated final report (with grade) from the tutor/student by the end of the exam session.
6. The report must contain the following information in the heather: Name of the laboratory: Geophysical Laboratory I (summer) or Geophysical Laboratory II (winter); academic year; full title of the exercise - including topic (a-g); name and surname of tutor(s); name and surname of the student; student registration number in USOS-UW; date on which the first report is submitted to tutor, and if necessary - the date of the revision of the report.
7. The report must be written in the English language.
8. Failure to submit the graded report to the coordinator by the end of the exam session of a given semester means an unsatisfactory grade (mark "2") from the given exercise.
9. The final grade obtained by the student is the average of the ratings of the individual reports (3 grades for GL II and 4 grades for GL I, including the unsatisfactory grades).
10. The coordinator proposes the final grade to the student no later than one week before the end of the exam session.
11. The final grade is inserted to USOS on the last day of the exam session.
12. It is possible to improve each report only once and no later than by the end of the make-up session of a given semester.
13. The final grade is then the average of 3 (GLII) or 4 (GL I) grades (highest grade per exercise).

MATERIAŁY DO ZAJĘĆ
Zajęcia / Prowadzący Typ zajęć

In this task, in-cloud conditions will be mimicked in the laboratory using a droplet generator.
A light frame will be used to observe processes such as intermittency and entrainment at the edges
of the artificial cloud. Statistical analysis of recorded images will be performed. A student will
also compare the post-processed pictures with the results of numerical simulations in a similar geometry.
Ultimately, this comparative approach aims to provide deeper insights into fine-scale atmospheric
mixing processes.

Laboratorium

The aim of the exercise is to analyse properties of biomass-burning aerosol. The goal is to derive profiles of aerosol optical properties, depolarization ratio and relative humidity, so as to characterize the atmosphere using the signals of ADR-PollyXT lidar and NARLa lidar. The student will use available lidar observations in combination with weather profiling of radiosounding and photometric measurements. The data will be processed using available numerical programs, including estimates of measurement errors. For the analysis and interpretation of the processed data, the student will use the methodology proposed by him/herself.

Laboratorium

Maciej Karasewicz, Łucja Janicka

Doppler lidar system allows for obtaining vertical profiles of wind vector within the atmospheric boundary layer with high spatial and temporal resolution for atmospheric applications. The aim of this exercise is to be able to filter and process the data to properly represent, understand and interpret different patterns observed with Doppler lidar (e.g. related to nocturnal jets or daytime convection). The analysis will cover several examples measured over a peatland site in Rzecin and/or at urban site in Warsaw.

Laboratorium

The aim of the exercise is to derive properties of minerat dust agigination if African or Asian deserts. The profiles of aerosol optical properties, depolarization ratio and relative humidity will be obtained, so as to characterize the atmosphere using the signals of ADR-PollyXT lidar and NARLa lidar. The student will use available lidar observations in combination with weather profiling of radiosounding and photometric measurements. The data will be processed using available numerical programs, including estimates of measurement errors. For the analysis and interpretation of the processed data, the student will use the methodology proposed by him/herself.

Laboratorium

Understanding aerosol impact requires quantification of its vertical movement and exchange rates within the atmospheric boundary layer (ABL). This excersize focuses on utilizing high-resolution data from a Doppler lidar to estimate vertical aerosol fluxes by combining wind velocity measurements with aerosol optical properties.  Students will learn to apply advanced micrometeorological methods to remote sensing data. Tasks to be performed include: data preprocessing and quality control: aerosol flux estimation uding co-variance method, boundary layer assesment throughout the diurnal cycle, comparative study of ryral vs urban conditions.

Laboratorium

Turbulent Kinetic Energy (TKE) dissipation rate is a key physical quantity characterizing turbulent air motions present in the atmosphere. According to Kolmogorov’s theory, its value can be derived from velocity fluctuations, measured e.g. with a stationary ultrasonic anemometer or various airborne instruments. The goal of the exercise is to learn several approaches for estimation of TKE dissipation rate (power spectrum, structure functions, number of crossings), apply them for the velocity data collected routinely at the top of the institute building and compare the results for the period of a few days.

Laboratorium

This exercise is an introduction to computer simulations using particles. The method of smoothed particle hydrodynamics (SPH) will be used to study some nonlinear phenomena of relevance for atmospheric physics. Programing skills and basic knowledge of theoretical methods in hydrodynamics are required for this task.

Laboratorium

The aim of the exercise is to derive the profiles of the aerosol depolarization (UV and VIS), water vapour mixing ratio, and fluorescence efficiency from the European Space Agency Mobile Aerosol Raman EMORAL lidar signals. Student will use lidar measurements for different cases, e.g. Rayleigh atmosphere, air-mass of biomass combustion, and air mass of mineral dust. She/He will write numerical programs or use an existing software for the retrieval of the aforementioned profiles in the atmosphere, estimate the measurement uncertainties, and perform a comparative analysis and interpretation of the diffrent cases. The feasibility of using the obtained information for aerosol typing will be assessed for tropospheric and stratospheric measurements.

Laboratorium
Large Eddy Simulation (LES) technique has become an important tool in the atmospheric turbulence research.
In this method the largest eddy structures are resolved on a numerical grid, while the effect of smaller
(subgrid) eddies is taken into account through a proper closure. John Hopkins Turbulence Database contains
datasets with results of Direct Numerical Simulations and Large Eddy Simulations of various test
cases, including geophysical rotating stratified turbulence and LES of the stably stratified turbulence.

Within this task a student will get acquainted with the basic data formats used to store the data and learn
about methods to download and post-process the data. The task is to calculate mean quantities like mean velocity,
mean temperature and fluxes from the given fields and plot them as a function of height. The student
will calculate the Obukhov length and study turbulence statistics in the region of the surface layer,
as well as identify the presence of the Ekman spiral at larger altitudes.
Laboratorium

NOTE: This topic is open for realization only for students who already have experience with atmospheric physics!

The exercise aims at familiarizing students with the basic microphysical properties of clouds (concentration and size of cloud droplets), their variability in space, and their dependence on the type of cloud. The exercise will involve the analysis of the measurement data from the ACE2 (Second Aerosol Characterization Experiment, Canary Islands) and the RICO (Rain in Cumulus over the Ocean; Caribbean, 2004-2005) experiments carried out in Stratocumulus and Cumulus clouds, respectively. The implementation of this exercise will allow students to effectively learn the basic (and more advanced) parameters characterizing clouds, understand and remember which are the most important processes that govern clouds.

Dokumenty do zajęć:
Instrukcja do ćwiczenia z eksperymentu ACE2
Instruction_microphysics_ACE2.pdf
ReadMe
ReadMe_ACE2.txt
Dane z lotu fr9721 eksperymentu ACE2
113747.2H0001
Dane z lotu fr9730 eksperymentu ACE2
121129.4H0001
Publikacja ACE2
Brenguier_etal_JGR_2003.pdf
Publikacja ACE2
Brenguier_etal_Tellus_2000_CloudyColumn.pdf
Publikacja ACE2
Pawlowska_etal_Tellus_2000.pdf
Publikacja ACE2
Raes_etal_Tellus2000_ACE2_overview.pdf
Instrukcja do ćwiczenia z eksperymentu RICO
Instruction_microphysics_RICO.pdf
ReadMe
ReadMe_RICO.txt
Dane z lotu RF06 eksperymentu RICO
RF06_hc0407_162400.0R0001
Dane z lotu RF07 eksperymentu RICO
RF07_hc0408_150000.0R0001
Publikacja RICO
Arabas_et_al_2009_GRL.pdf
Publikacja RICO
Rauber_etal_2007_RICO.pdf
Adiabatic Liquid Water Content
adiabaticLWC.pdf
Constants
constants.pdf
Laboratorium

Understanding cloud droplet formation is fundamental in cloud physics. Water vapor condenses in the atmosphere on tiny aerosol particles when supersaturation slightly exceeds the equilibrium saturation. Köhler theory explains the equilibrium saturation of a solution droplet, such as a wetted aerosol particle, and thus determines whether it grows by condensation or shrinks by evaporation. If the ambient supersaturation exceeds its critical value, the particle grows freely, a process referred to as activation. The aerosol particle is considered a cloud droplet once it is activated. For a given ambient supersaturation, whether an aerosol particle of a given size and chemical composition is activated depends on its critical supersaturation.

The activation spectrum describes the relationship between the number of activated particles and supersaturation. The activation spectrum, typically denoted as  N(S) or NCCN(S) , is a cumulative distribution function. It describes the total number concentration of aerosol particles per unit volume of air that will activate and grow into cloud droplets at or below a specific environmental supersaturation, S.

The exercise consists of calculating the activation spectrum for a given, constant supersaturation and comparing that result with the activation spectrum generated by a simple cloud model.

In your exercise, you will be using a bimodal lognormal size distribution of dry aerosol particles. To get the activation spectrum from this, you must link the physical size of the dry particle (rd) to its critical supersaturation (Sc).

Using Köhler theory, you determine the critical supersaturation Sc required to activate a particle of a given dry radius rd and chemical composition (often parameterized by the hygroscopicity parameter, κ).

If the ambient supersaturation is S, any particle with a critical supersaturation Sc≤S will activate. This corresponds to all particles with a dry radius greater than some critical activation radius, rcrit(S).

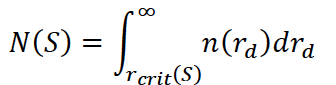
The activation spectrum is calculated by integrating the dry aerosol size distribution n(rd) from that critical radius up to infinity: 

This physically derived spectrum shows that as ambient supersaturation increases, smaller and smaller particles (which are usually vastly more numerous) are forced to activate, causing N(S) to rise steeply.

Bimodal lognormal aerosol size distributions parameters to be used in the exercise:

Bimodal lognormal aerosol size distributions parameters to be used in the exercise:

Aerosol type

N1 (cm-3)

rd1

σ1

N2 (cm-3)

rd2

σ2

VOCALS

60

0.020

1.4

40

0.075

1.60

marine

125

0.011

1.2

65

0.060

1.70

polluted

160

0.029

1.36

380

0.071

1.57

Laboratorium

The finite inertia of droplets in a turbulent fluid causes droplets to diverge from regions of high vorticity and to converge preferentially in regions of low vorticity. This creates strong deviations from uniformity in droplet concentration. The aim of the exercise is to simulate the motion of droplets (modeled as point-particles) in a synthetic turbulent flow under the influence of gravity. Simulation results should explain to what extent droplet inertia, gravity, and turbulence affect droplet spatial distribution.

Laboratorium

Size distribution of droplets and their concentration in a unit volume are basic microphysical properties characterizing the cloud. Knowing both, one can also calculate total liquid water content. The goal of the exercise is to introduce the method of measuring those parameters with shadowgraphy. Student’s tasks include the lab measurement of droplet sizes and concentrations in the streams generated by a few different devices (e.g. pond mist maker, household humidifier, flower sprayer, nasal hygiene spray), comparing the properties of the obtained size distributions and estimating total liquid water content.

For ambitious: The second goal of the exercise is to introduce optical techniques for measuring size distribution and fall velocity of rain drops, as well as rainfall rate. Student task’s involve selecting the proper experiment time based on weather forecast, measuring rain drop sizes and velocities at the roof of the institute building with shadowgraphy technique and comparing the results with routine observations performed with a disdrometer.

Dokumenty do zajęć:
Measurement of cloud droplet size and concentration with shadowgraphy - instructions - Skrypt do ćwiczeń
shadowgraph_intro_JN2020.pdf
Laboratorium

The exercise is aimed at determination of the thermal conductivity of granular ice, or natural snow (if it is available) without sampling the test material. The measurement is made using linear probe technology. It is used in practice in situations when taking a sample of the material is inexpedient or technically impossible. This method is applied to investigate directly (in-situ) properties of cosmic bodies using automatic landing probes, e.g. comet Churyumov-Gerasimenko (mission Rosetta, experiment MUPUS).

Idea is the following: changes of the temperature of a long thin heater inserted in a solid material is a function of its thermal conductivity. When the heating power is known it is sufficient to register  changes of the temperature. The latter can be done automatically. 

Student is expected to perform 2 -3 measurements and analyze the source data. 

This exercize is dedicated to advanced student.

Note that, due to the COVID-19 situation, the student will receive raw measurement data for analysis.

Laboratorium

The rate of sublimation is commonly calculated using simple Hertz-Knudsen equation. This equation was derived ignoring microstructure of material and assuming equilibrium distribution of the velocities of molecules condensing on the surface and leaving it. Thus, is it gives only approximate result. It can be corrected using temperature dependent sublimation coefficient (e.g. Kossacki et al. 1999; Gundlach et al. 2011; Kossacki et al. 2017). 

Exercise: Sublimation of ice is investigated in laboratory, using cooled vacuum chamber. Measured parameters are: position of the surface and the temperature. Student is expected to perform measurement and derive the temperature dependent rate of sublimation.

This exercise is dedicated to advanced student.

Note that, due to the COVID-19 situation, the student will receive raw measurement data for analysis.

Laboratorium

The ultrasonic anemometer installed ontop of the institute building records three components of the air flow velocity and virtual temperature at a rate up to 32 Hz. Measured fluctuations of velocity and virtual temperature allow for the calculation of turbulent fluxes of momentum and heat in the boundary layer of the atmosphere with the use of eddy correlation method. Relationship between those quantities determines, in turn, the dynamic stability in the layer, which is customarily expressed by the Monin-Obukhov length. Student’s tasks involve performing Reynolds decomposition of the recorded signals, calculating respective turbulent fluxes, deriving Monin-Obukhov length and analyzing its variability in the course of a few selected days.

Laboratorium

The exercise is aimed at determination of the thermal conductivity of sand without sampling the test material. The measurement is made by linear probe technology. It is used in practice in situations when taking a sample of the material is inexpedient or technically impossible. This method is applied to investigate directly (in-situ) properties of cosmic bodies using automatic landing probes, e.g. comet Churyumov-Gerasimenko (mission Rosetta, experiment MUPUS).

Idea is the following: changes of the temperature of a long thin heater inserted in a solid material is a function of its thermal conductivity. When the heating power is known it is sufficient to register changes of the temperature. The latter can be done automatically.

Student is expected to perform 2 -3 measurements and analyze the source data.

Alternatively, student may process the existing source data.

This exercise is dedicated for beginner student.

Laboratorium

The aim of this exercise is to study processes of formation and evolution of cloud droplets. It will be realized using an existing numerical parcel model (https://github.com/igfuw/parcel). Main tasks include:  getting acquainted with the model documentation, installation of the model, running of a set of numerical simulations. Results obtained will have to be thoroughly analyzed in order to identify parameters having impact on droplet size distribution. Realization of this exercise will result in effective understanding of parcel model as a tool used in numerical simulations of cloud processes, and also deeper understanding of cloud microphysical processes.

Laboratorium

Agnieszka Makulska, Hanna Pawłowska, Piotr Dziekan

The goal of the exercise is to simulate collisions between droplets that lead to the formation of rain in a simplified model. A small volume of cloudy air is considered. Droplets fall with terminal velocities that depend on their sizes - larger droplets fall faster and collect smaller ones. Additionally, droplets move in the turbulent air flow (which can be represented in the simplified model as a random motion). Results of the model with different initial droplet size distributions will be compared.

Laboratorium

This exercise concerns the numerical calculation of scalar advection (temperature and water vapor) in a synthetic cloud flow. Condensation is performed using an instantaneous saturation adjustment scheme. This simple condensation model should provide reference results for testing and development of more sophisticated cloud microphysical schemes. Programming skills and basic knowledge of cloud physics are required.

Laboratorium

Numerical cloud models produce output in the form of 3-dimensional arrays of variables of interest (e.g., cloud water content). Visualizing this data, which helps in understanding model behavior and is useful for science outreach, is a separate task. In this lab, students will produce a video of a cumulus congestus cloud modeled with the UWLCM model (model output will be provided). The video will be made using ParaView — a standard tool for scientific visualization. ParaView can be used through Python. Python scripts that can be used as a starting point for this laboratory can be found here: https://github.com/igfuw/UWLCM_plotting/tree/master/paraview_scripts

Example of a visualization from a different model: https://www.youtube.com/watch?v=dxoIdczz-gc

Laboratorium

UWLCM is a tool for numerical modeling of clouds using the Large-Eddy Simulation (LES) approach and detailed Lagrangian microphysics. Detailed cloud simulations are too costly to be run on a single computer. Instead, such simulations are performed on clusters of computing nodes with distributed memory (supercomputers). Communication between nodes incurs an additional cost that slows down such simulations. Therefore, to find an optimal balance between computation time and the usage of computational resources, it is necessary to perform scalability tests of the model, in which computational time is compared for a varying number of nodes. Various scenarios are considered, such as weak scaling (in which the problem size increases with the number of nodes) and strong scaling (in which the total problem size remains constant). An additional consideration for UWLCM is that it uses both CPUs and GPUs for computations, and the percentage of time both processing units work simultaneously depends on the number of nodes. Scalability tests on the Cyfronet Prometheus cluster are described in: https://gmd.copernicus.org/articles/15/4489/2022/ .

The student's task will be to perform similar tests on a newer cluster. This may require setting up the environment to run the UWLCM model and finding optimal run parameters. Availability of this laboratory is subject to access to supercomputers.

Laboratorium

Students will learn how to run and analyze numerical simulations of clouds. Simulations will be done using the University of Warsaw Lagrangian Cloud Model, a state-of-the-art model developed at IGF. Data analysis will make use of the Xarray Python package. Both simulations and data analysis will be done through a Jupyter Notebook ran on a supercomputing cluster. Basic knowledge of Python programming language is the only prerequisite for this laboratory.

Dokumenty do zajęć:
Opis ćwiczenia - Skrypt do ćwiczeń
Cloud_modeling_introduction.pdf
Laboratorium

Mixed-phase clouds are three-phase systems consisting of water vapor, ice particles and supercooled liquid droplets. In this exercise the student will model and simulate the phase partitioning of water condensate in mixed-phase clouds using a bulk microphysical approach. Simulations will be made for the adiabatic cloud parcel model. We plan the following course of the exercise: learning the model equations and the thermodynamics of mixed-phase systems, developing the numerical code and conducting calculations for various model parameters. The simple modeling approach used in this exercise should provide reference results for testing and development of more sophisticated microphysical schemes.

Laboratorium

Rain drops are formed through coalescence of smaller droplets, which is a consequence of collisions between droplets. Student task will be to model the collision-coalescence process using a probabilistic description. The goal is to quantify the number of "lucky" droplets, which are droplets that undergo a series of unlikely collisions and grow to much larger sizes than average droplets. Results will be compared with theoretical estimates. This exercise is intended as a follow-up to the exercise "Simple model of collision-coalescence in clouds".

Laboratorium

Aethalometer and Polar nephelometer are used to measure aerosol absorption and scattering coefficients. In case of both devices, due to the measurement methodology, determination of such quantities requires applying a series of corrections. As a part of the exercise, student will write the software to derive the single scattering albedo. The method is to be applied in urban polluted (Warsaw) and rural (Strzyżów) conditions.

Laboratorium

The exercise aims at determining effects of relative humidity on optical and microphysical properties of aerosol in laboratory conditions. Measurements will be conducted using the aerosol condition system (ACS1000), which allows for applying controlled changes of relative humidity upon the air collceted using the inlet located on the measuring platform. The chamber consists of two measuring paths: one that contains dehumidified air with low relative humidity (approx. < 30%), while the other contains air that moves through a special moisturizing system enabling the setting of desired humidity value in the range from 40 to 90%. Both measurements take place simultaneously with the used of miniature OPC-N3 particle counters. This enables to determine changes in the particle size distribution and the scattering coefficient as the air humidity changes.

Laboratorium

The aim of the exercise is to estimate the aerosol radiation forcing on the basis of observation of surface solar flux and radiative transfer simulation of aerosol-free solar fluxes. In addition, the radiation budget at Earth’s surface will be determined, as well as the total energy budget, including sensible and latent heat fluxes.

Laboratorium

The aim of the exercise is Langley calibration of the Multifilter Rotating Shadowband Radiometer and deriving aerosol optical depth and Angstrom exponent. Student will work with data from MFR-7 mounted in Radiative Transfer Laboratory at the roof platfor of the Institute of Geophysics. During the exercise, the data processing will be done, including several corrections.

Laboratorium

The main goal of this study is to update a simple global mean, zero-dimensional, climate model developed by University of Reading and to run simulation to estimate the optimal model parameters. This two layer aqua planet model solve two differential equations for mixed layer and deep layer temperature anomaly which is forced by the mean radiative forcing. The main task is to extend the simulation to 2019 based on last IPCC data. The next one is to develop the minimization method to estimate the best model parameters based on observation data and model results.

Laboratorium

The exercise is to define a methodology for synergistic data analysis of the ESA EMORAL lidar and the LATMOS BASTA cloud radar profiles to predict the tempo-spatial distribution of aerosol and clouds in the atmosphere. The key issue here will be (a) correctly calibrating the measurements taken by both devices and b) setting and optimising signal thresholds to distinguish different types of aerosol and clouds.

Laboratorium

The exercise aims to familiarize students with satellite remote sensing, widely used in atmospheric research. In this case, it is crucial to understand the design of the algorithms used for different detectors. As part of the classes, students will also conduct analyses of satellite data for a given case study (to be determined together with their supervisor) in terms of various parameters, such as atmospheric aerosols, cloudiness, and anthropogenic pollution.

Laboratorium

Tycjan Kossowski-Kołodziej, Iwona S. Stachlewska

The AERONET (AErosol RObotic NETwork) program is a federation of ground-based remote sensing aerosol networks established by NASA and LOA-PHOTONS (CRNS) and provides a long-term, continuous and readily accessible public domain database of aerosol optical, microphysical and radiative properties. The standardization of instruments, calibration, and processing by the network allows for directly comparing aerosol properties from different environments. This exercise is intended to focus on the characterization of aerosol load, optical and physical properties as well as on their temporal variability over a rural site versus urban and peri-urban sites using long-term measurements with AERONET sun-photometers.

Goal of this exercise was to characterize properties of atmospheric aerosols over three different sites. For this purpose the AERONET sun photometer database will be used. The measurement sites will be chosen by the student and reasoning for the choice need to be carefully explained. The data for at least one year at each site need to be investigated. For the daily average values of aerosol optical depth and Angstrom exponent a classification into 3 groups with low, medium and large values need to be done, followed by description of each.

This topic can be realized in extended version with use of the ocean color data and lunar data.

Laboratorium

Student will analyse the data collected during measurement campaign involving scanning lidar observations of aerosphere and ocean over the Tresna lake in Poland. The observations were conducted in October 2024 using the scanning lidar of University of Silesia. Assessment of the scanning lidar data at four channels (2 aerosol, water, nitrogen) at different incidence angles into the water surface will be done. Analysis aims at determining the penetration depth and optical depth investigations.

Laboratorium

Maciej Karasewicz, Łucja Janicka

Doppler lidar system allows for obtaining vertical profiles of wind vector within the atmospheric boundary layer with high spatial and temporal resolution for atmospheric applications. The aim of this exercise is to be able to filter and process the data to properly represent, understand and interpret different patterns observed with Doppler lidar (e.g. related to nocturnal jets or daytime convection). The analysis will cover several examples measured over a peatland site in Rzecin and/or at urban site in Warsaw.

Laboratorium

The data products of the the European Space Agency (ESA) satellite lidars: the ATLID (Atmospheric Lidar) onboard EarthCARE and/or the ALADIN (Atmospheric Laser Doppler Instrument) onboard  the ADM-Aeolus  will be verified againts he ground-based lidars datasets collected with the ACTRIS Mie-Raman lidar PollyXT/NARLa and the ACTRIS Doppler lidar HALO, as well as againgt the ESA mobile reference cal/val lidar EMORAL. The student will perform the verification of the lidar profiles that are already evaluated by RS-Lab Team. A careful verification of the overpasses times against the calculated profiles (+/-1h, +/-100m form overpass), writing the profiles plotting routine to display the data, defining the robust terms to assess their quality, and making a decision of their usefulness for cal/val of satellite data will be core part of the work.

Laboratorium

A stable atmospheric boundary layer (SBL) forms when the air near the surface is colder than the air above, creating a temperature inversion that suppresses vertical motion. SBL is typically observed during clear nigths over land or over cold surfaces like ice in the Arctic. The vertical mixing in SBL is suppressed by the negative buoyancy. Turbulence is driven by wind shear and often becomes intermittent and patchy.

In this task MOSAiC database from Arctic will be used to perform Reynolds decomposition of wind and temperature into the mean and fluctuating part. For this, different sizes of averaging windows will be used to investigate how they affect the decomposition. Next, Reynolds stresses and heat fluxes will be calculated and stability of the surface layer will be estimated.

Laboratorium

Powrót do listy przedmiotów